Discover The most Important 12 Data Analysis Process Steps
- Posted by:
- Category: Uncategorized

Did you know that many companies that rely on data to make decisions are more profitable than those that don’t use it? It takes more than just collecting data; you need to follow the data analysis process steps from start to finish, from collecting data to cleaning and analyzing it, to making decisions based on it.
In this article, we will discuss what data analytics is, its importance, the basic steps that must be followed to analyze data accurately and effectively, and data analytics tools. Let’s start with the definition of data analytics.
What is data analytics?
Data analytics is the understanding and extraction of information and details from data that helps to make sound decisions in the present and clarifies the future vision of the company. It is the science of transforming data into clear insights and actionable decisions based on facts, not assumptions.
Data analytics is not just an optimization tool, it is a strategic investment that helps companies survive and compete in a rapidly changing market.
The importance of data analytics

The importance of data analytics comes in clarifying the full vision based on which decisions are made. Data analytics helps:
-
identify inefficiencies
in business processes and identifies unnecessary expenses and allows minimizing them, enabling companies to find ways to reduce costs, increase productivity, and reduce time.
-
Boost productivity
Data analytics helps increase revenue and boost productivity by providing insights into product development and customer retention
-
Decision
Making Data analytics transforms sound decision-making from relying on assumptions and intuition to decisions based on evidence and facts
-
Risk mitigation
Data analytics can be described as an eye to the future, as it helps predict risks and resolve issues before they occur, which is invaluable to organizations.
-
Improving the customer experience
Identifying customer wants and preferences and meeting their needs enhances customer satisfaction and loyalty, which is one of the most important goals of data analytics.
-
Identify and capitalize on new opportunities
Data analysis reveals new market opportunities and avenues for expansion. This insight allows companies to innovate and enter new markets with a strong foundation of data.
Types of data analysis
There are many types of data analysis and each one offers different insights depending on the goal of the analysis and the type of data available.
Here are the main types of data analysis:
-
Descriptive Analytics:
This type is the first foundation for understanding data. It summarizes past events using tables and graphs.
For example, it helps companies learn about monthly sales or customer interaction patterns in the past.
-
Diagnostic Analytics:
It aims to understand the underlying causes of events. Using this type, companies can find out the reasons why sales dropped in a certain period or the rate of customer complaints increased.
-
Predictive Analytics:
Used to predict what might happen in the future based on historical data and machine learning models.
For example, predicting an increase in demand for a particular product during a particular season based on data from previous years.
-
Prescriptive Analytics:
This type provides practical recommendations and solutions based on past data and analysis. It helps companies make informed decisions such as optimizing processes or designing targeted marketing strategies.
-
Exploratory Data Analysis (Exploratory Data Analysis – EDA):
Exploring data to uncover unexpected patterns and relationships.
Uses techniques such as infographics and statistical analysis.
Example: Discovering a relationship between weather and sales of cold drinks in Saudi Arabia.
Data Analysis Process Steps
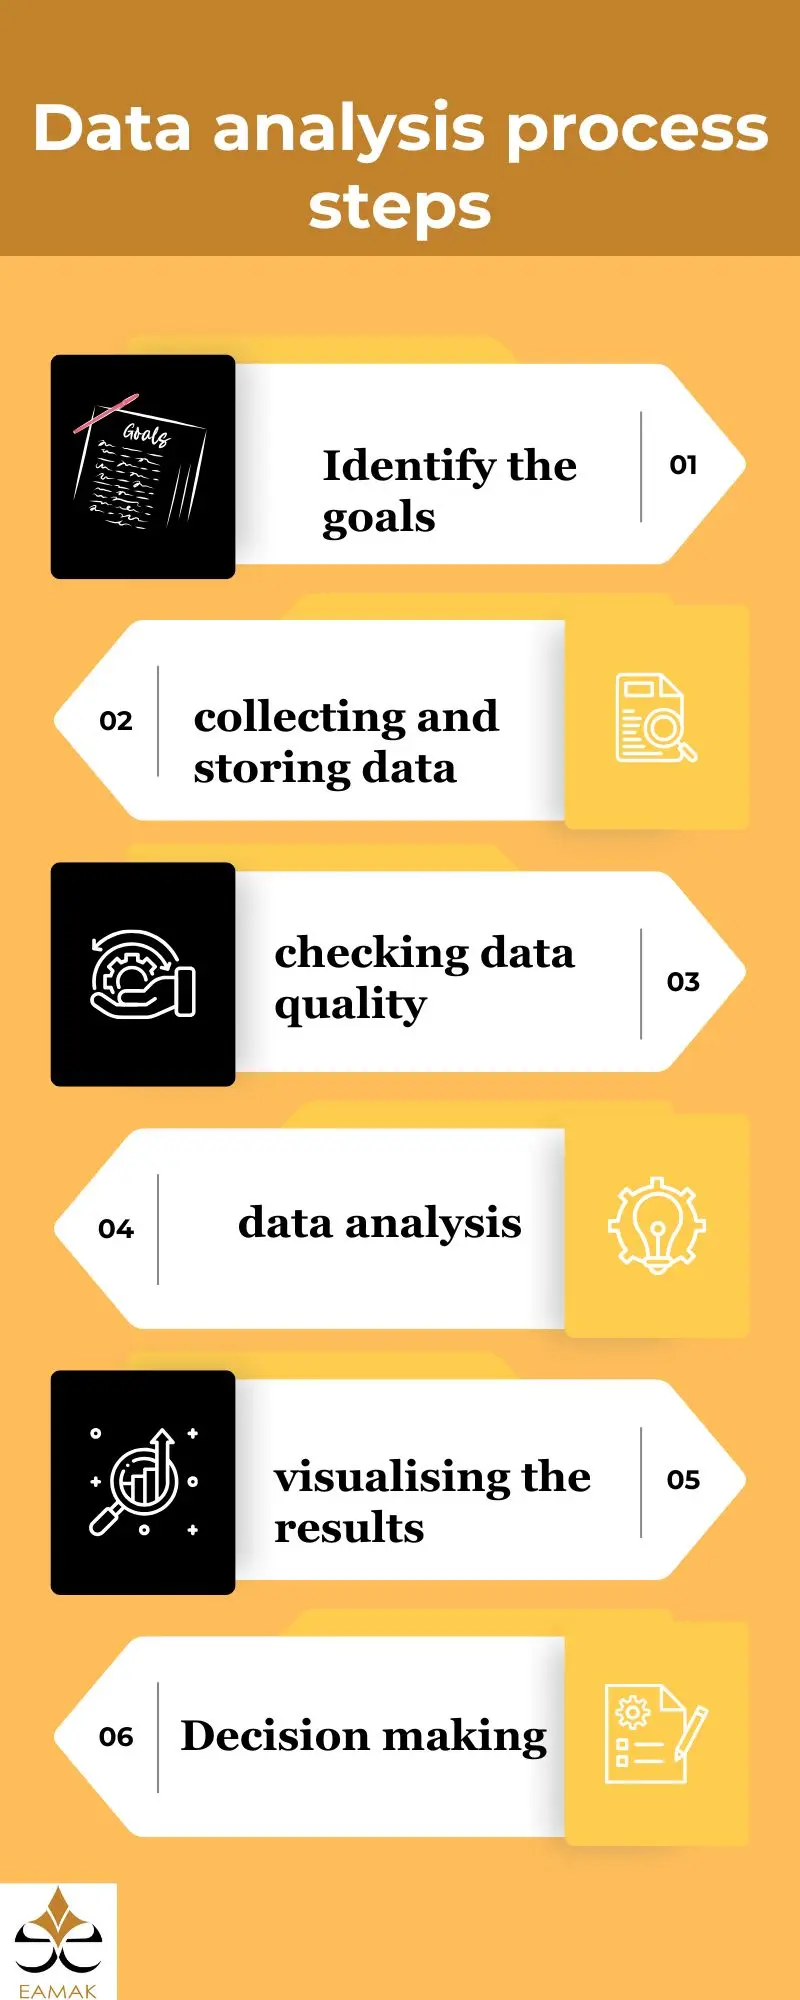 Data analysis process steps are the stages that data goes through to finally reach specific data that helps in solving a specific issue or making fact-based decisions. These steps can be summarized as follows:
-
Identify the goal
This is the first step that determines the data needed to solve a specific issue and defines the metrics and indicators to measure the results.
-
Collecting and storing data
After defining the goal comes the step of collecting relevant data by extracting from available databases, questionnaires, or interviews.
-
Checking data quality
This step is very important because it involves checking the quality of the data and the high degree of confidence that helps in identifying and correcting errors; to get accurate and meaningful results from the analysis.
-
Analyze
the data Now is the time to analyze the data to discover patterns, relationships, or trends by applying statistical or mathematical techniques. Many tools and programs help with this such as Excel, Python, SAS, etc.
-
Visualizing the results
after analyzing the data helps to present them for easy understanding and provides a clear picture. Data can be visualized by creating charts, graphs, or other representations.
-
Decision-making
Data analysis helps to make decisions based on facts and facts, not guesses, and are actionable decisions that solve current issues and provide a future vision on which current decisions are made.
Data analysis methods
Data analysis methods help extract useful insights from data. These methods vary depending on the type of data and the goal of the analysis. Some of the most prominent data analysis methods
-
Statistical analysis:
This method relies on the application of statistical techniques such as regression and analysis of variance to understand the relationships between variables. For example, companies can use statistical analysis to identify the factors influencing the decline in sales. The importance of this method lies in providing an in-depth understanding of the data and the relationships between its elements.
-
Quantitative data analysis
This method focuses on numbers and measurable data such as profits and costs. It is used to determine the financial performance of companies. For example, analyzing quarterly earnings to determine financial growth and make investment decisions.
Some of the techniques used to analyze quantitative data include analysis of variance (ANOVA). Correlation Analysis.
-
Qualitative data analysis
Focuses on analyzing non-digital data such as texts, opinions, reviews, and customer feedback. It is used to understand how customers feel about a particular product. Example: Analyzing user comments on social media to understand customer satisfaction and improve products accordingly. Some of the techniques used:
– Content Analysis.
– Thematic Analysis.
-
Time Series Analysis
Is used to analyze data collected over time to predict future changes such as seasonal sales.
Example: Analyzing the demand for a particular product during holiday seasons to determine the right quantities to manufacture. Some of the techniques used are:
– Trend Forecasting.
– Seasonality Analysis.
-
Big Data Analysis
focuses on analyzing massive amounts of data using advanced techniques.
Real-time Processing.
– The use of machine learning algorithms to
analyze social media and advertising
data: Used to analyze social media and internet data
-
Exploratory Data Analysis (EDA)
Exploratory Data Analysis (EDA) is an essential step to understand the nature of the data before proceeding to advanced analysis. It aims to discover patterns, outliers, and key characteristics of the data using techniques such as pivot tables and interactive charts. Example: Using graphs to understand the distribution of sales of a particular product over a year. Its importance lies in providing initial insights that help improve decision-making.
-
Predictive Analytics Predictive
Analytics focuses on seeing the future based on current data. Using techniques such as statistical modeling and machine learning, companies can predict the occurrence of certain scenarios.
Example: Insurance companies use this method to estimate the likelihood of accidents based on customer behavior and past data.
The importance of this method lies in enhancing preparedness and making proactive, informed decisions based on building mathematical models using machine learning techniques to predict future events based on current data. It is used in strategic planning and risk management.
-
Prescriptive Analytics
Is the most advanced type of data analysis
that provides practical recommendations based on the results of the analysis. Using complex algorithms, optimal actions to achieve goals can be determined.
Example: Making recommendations on how to allocate resources to optimize productivity. Its importance lies in transforming data into operational strategies.
-
Cluster Analysis:
It aims to divide data into homogeneous groups based on common characteristics. Example: Segmenting customers into categories based on their purchasing preferences to design personalized marketing strategies
Data analysis tools
Data analysis tools help to understand data and translate it into clear information, here is a list of the most important data analysis tools with an explanation of each tool, its uses, and features:
-
Python
Is a versatile programming language that is widely used for data analysis thanks to its powerful libraries such as Pandas (for data management), NumPy (for numerical calculations), and Matplotlib (for graphs).
Python is used for
- Processing raw data, analyzing it, and creating graphical visualizations.
- Writing code using editors like Jupyter Notebook.
- Analyzing big data.
- Building predictive models using Machine Learning (such as the sci-kit-learn library). Data visualization.
-
R
Is a programming language for statistical and graphical analysis that is widely used in research and academia.
It is used to
- Analyze complex data and create advanced graphical visualizations using libraries such as ggplot2 and dplyr.
- It is used for statistical analysis, data reporting and analysis in research, and predictive modeling.
-
Tableau
Is a powerful data visualization tool, used to create interactive dashboards and graphs to easily understand data. Tableau can be connected to various data sources (Excel, databases, or the cloud) and then create visualizations using a drag-and-drop interface.
Areas of use:
- Monitor financial performance.
- Analyzing customer data.
- Business process monitoring.
- Microsoft Power BI
Power BI is a business intelligence tool for analyzing data and creating reports and dashboards.
Data can be imported from multiple sources and then use interactive tools to create visualizations that aid in decision-making.
Areas of use:
- Analyze sales performance.
- Monitor business metrics.
- Analyze customer data.
-
Apache Spark
Is an open-source platform for processing and analyzing big data quickly and efficiently. It is used to analyze massive amounts of data in real time using languages like Python or Scala.
Areas of use:
- Analyzing big data.
- Temporal data processing.
- Machine learning.
-
Google Data Studio
Is a free tool from Google for visualizing data and creating interactive reports. It can be connected to sources like Google Analytics or Google Sheets to create interactive dashboards.
Areas of use:
- Analyze the performance of marketing campaigns.
- Monitor website visitors.
-
SQL
Is a database management language used to extract and analyze data. Queries are written to analyze data stored in databases such as MySQL or PostgreSQL.
Areas of use:
- Extracting and analyzing customer data.
- Inventory control and operations.
-
Zoho Analytics
Is a platform for data analysis, report generation, and business intelligence. Used to connect data from multiple sources and analyze it using built-in AI.
Areas of use:
- Analyze team performance.
- Create KPI dashboards.
-
Microsoft Excel
Is a data analysis and organization tool that is widely used in many fields to analyze and visualize data, thanks to its simple interface and diverse functions. It can be used to:
Create tables to analyze and format data.
Use formulas such as SUM, AVERAGE, and VLOOKUP to perform calculations.
Create charts such as columns and circles to visualize data.
Analyze data using Pivot Tables to dynamically summarize data.
Import and export data between Excel and other programs.
Areas of use:
- Analyze financial and accounting data.
- Inventory tracking and logistics data management.
- Create monthly reports and graphical visualizations.
- Analyze sales and performance data.
-
KNIME
KNIME (Konstanz Information Miner)
is an open- source platform for data analytics and machine learning, based on Workflow to facilitate data processing. It is used to build and analyze workflows using a drag-and-drop interface to process and analyze data without the need to write code.
Areas of use:
- Analyzing complex data.
- Predictive modeling.
- Data Mining.
Big Data Analytics
Big Data Analytics is the analysis of huge sets of data that cannot be processed using traditional databases or analytical tools. This data ranges from Structured Data such as regular databases to Unstructured Data such as text, images, and videos.
Characteristics of Big Data Analytics
-
Volume
This is the very large volume of data collected daily from multiple sources such as the Internet, social networks, and sensors. For example, internet users generate billions of messages every day on platforms like Twitter and Facebook, and smartphones generate huge amounts of data.
-
Velocity
The speed at which data is generated and processed. This data often requires Real-Time Processing, such as analyzing data from connected devices or responding to interactions on social media platforms.
-
Variety
Big data not only comes in the form of structured data, but also includes unstructured data such as text, images, audio, and video.
-
Value
Big data provides tremendous value when analyzed effectively. Insights can be extracted that help companies optimize their strategic decisions
Areas of use of big data analytics
-
Healthcare
Big data analytics can help deliver better healthcare by analyzing patient records, medical images, and pattern analysis to predict diseases. For example, data analysis can be used to predict the emergence of epidemic diseases or to monitor the progress of a particular disease.
-
Financial sector
Big data is used in the financial sector to analyze financial transactions, predict market fluctuations, and analyze credit risk. Algorithms are also used to detect fraudulent activities in real time.
-
E-commerce
Using big data analytics, merchants can learn customer preferences and analyze their behaviors to increase sales and improve the user experience. For example, companies like Amazon and Netflix use data analytics to recommend products or movies based on history.
-
Energy and transportation
In the energy industry, big data can be used to analyze energy consumption and predict electricity demands. In transportation, it can be used to analyze traffic-related data and improve planning.
-
Cybersecurity
Big data analytics is used to analyze security logs and detect suspicious activities or cyberattacks in real time. For example, data from millions of devices can be analyzed to detect security threats.
12 Common Mistakes to Avoid in Data Analysis Process Steps.
Data analysis process steps is a complex process that requires attention to detail and careful use of tools and techniques. Several common mistakes that can affect the quality of the analysis and lead to inaccurate or misleading results. Here are the most common mistakes:
-
Not clearly defining the goal
Starting the analysis process without clarity on the goal that the analysis seeks to achieve. This leads to scattered and unfocused analyses.
-
Ignoring Data Quality
Analyzing unclean or inaccurate data leads to erroneous conclusions. Issues may include missing values, duplicate data, or anomalous values.
-
Using inappropriate or insufficient
data Selecting an inappropriate or insufficient dataset to meet objectives. Insufficient data may lead to inaccurate conclusions.
-
Not taking the normal distribution of the data into account
Not having a good understanding of the distribution of the data (e.g., normal distribution or irregular distribution) and not using appropriate methods of analysis based on that understanding.
-
Over-reliance on complex models
Using overly complex models unnecessarily. Complex models may be useful in some cases, but they can lead to increased error or chaos if they do not have a strong foundation.
-
Ignore analysis of variance or influencing factors
Ignore other factors that may affect the data or the relationship between variables. This may lead to wrong or fallacious conclusions.
-
Relying on small samples
Using small or unrepresentative samples may lead to biased or inaccurate analyses.
-
Misinterpretation of correlation rather than causation
Assuming that there is a causal relationship between two variables only because there is a connection between them. For example, it may be observed that there is a link between rising temperatures and increased ice cream sales, but this does not necessarily mean that rising temperatures cause increased sales.
-
Omission of outliers
Failure to recognize or misinterpret outliers can affect the results of the analysis.
-
Not updating data or forms
Using outdated data or outdated statistical models that do not reflect current conditions. This leads to inaccurate or inappropriate conclusions.
-
Underestimating the importance of human interaction in interpreting results
Relying entirely on algorithms and models without involving human analysis. Data do not always carry full meaning without contextual interpretation.
-
Failure to observe ethical laws and protect privacy
Collect or analyze data beyond legal or ethical limits. This can include collecting personal data without permission or analyzing data in a way that violates individuals’ privacy.
Future trends in data analysis
Future trends in data analysis point to the integration of new technologies such as artificial intelligence, big data, the cloud, and advanced predictive models. Artificial intelligence and machine learning will have a key role in providing accurate and immediate analytical solutions. Big data will continue to drive innovations by dealing with diverse and unstructured data. Companies and professionals in this field need to prepare for these transformations and adapt to new technologies to ensure they stay at the forefront of technological development and make the most of data.
Summary
Making random decisions is no longer an option. Successful companies rely on data analysis process steps to understand markets, improve performance, and anticipate challenges. That’s where Eamak comes in as a strategic partner that helps you turn your data into actionable insights, giving you a strong competitive advantage.
Don’t leave your decisions to chance. Let Eamak provides you with accurate analytics and thoughtful strategies to achieve your goals efficiently.
Get in touch with us today, and start your journey to smarter decisions and a more successful future!